For most annual accounts reporting, the key reports will be the annual income and expenditure and a balance sheet that is consistent with the net income and shows the change from the previous year.
For month to month financial management, an actual vs budget
report will be the principal monitoring tool. Donors may also want reports on
the use of their funds, some of which relates to the money received and spent.
The time intervals for these will not necessarily coincide with the financial
year.
Note that reports are customisable, see “customising-reports”. Also that you can make a report a favourite by clicking on the star icon. This brings that report into the report list shown when you click “Reporting”.
I have a short section on UK Charities SORP-compliant Statement of Financial Affairs (SOFA) and related reporting, following some guidance on the typical reports and how to produce them.
Actual vs Budget
There is a standard and usable “Budget Variances” report under Reporting/All Reports/Financial Performance reports. (You can pin it to the “Reporting” menu by clicking on the star next to it.) For me, it is a bit cluttered and it is also good to have the full year budget visible as a column. So there is a quick guide under “Customising reports” to creating an alternative report.
Variances and what to make of them
The main point of the “Actual vs Budget” report is to identify deviations from the expected budget via the “Variance” column. To avoid misleading numbers, be sure that the period you select is for complete months only (i.e. avoid ending part-way through a month). We are looking for the larger negative or positive variances with a view to understanding what lies behind them.
If the budget was realistic as to timing, the most straightforward message from variances is that we are receiving or spending more or less than expected. If this comes as a surprise, look at the details of the related expenditure to figure out what is going on (e.g. by clicking the related expenditure figure).
But a variance may also be due to the timing of the revenue or expenditure not being as predicted by the budget (without any implications for total expenditure during the year). Time spent investigating such cases is wasted time. So try to ensure that timings in the budget are realistic. Using the previous year’s expenditure as a starting point, as mentioned under “Budget”, is a good first approximation. If you think the revenue timing should be predicable from the previous year’s outcome – not so likely as for expenditure, I imagine – , then do the same to get your revenue budget.
Revenue and expenditure statement
This is a Profit and Loss report by another name. I suggest
using the new style Profit and Loss report. You can customise it not least in order to
change the wording to that more suitable to a charity, e.g. “Revenue and
expenditure” and “Surplus/deficit” instead of “Profit”.
Save as a custom report in order to retain the customisation
and if you check “Make custom report default”, then this report will pop up if
you select the new style “Profit and Loss” report from the reports menu.
You might also have the default view limited to Funding types “Restricted” and “Unassigned” so as to exclude what are really pass-through payments not truly to be regarded as your income or expenditure accounts.
Balance sheet
This report can be found at Reporting/All Reports/Financial Statements/Balance Sheet (New).
This is a listing of the value, on the selected date, of all
bank accounts (and other assets), along with money owing to others or owed to you. The difference in the net worth of the
organisation from the previous year should be the net income from the income
and expenditure statement.
If you have been reconciling all bank transactions
appropriately and making correct entries for items that do not immediately
affect cash holdings (e.g. invoices, bills, pay runs, depreciation), then the
balance sheet automatically produced by Xero should be a true representation of
your assets, liabilities, and hence net worth.
It is important, then, that you check the year-end values
for all items in the balance sheet with their true values for that date. If
they all check out, then you have your year-end accounts. If they don’t check
out, then you need to run down the source of the error and create or edit
entries in Xero accordingly.
Checking year end account balances
Generally, to check items in the balance sheet, you are going to start with examining the year’s transactions behind the closing figure by clicking on the blue number in the balance sheet report. (Tip: if you right click to Open in new tab, then it is quicker to go back to the balance sheet again or flip between views.)
Fixed assets
See the “Fixed Assets” section on registering and running depreciation of fixed assets. Note, though, that if you are fully depreciating assets at the time of their purchase, then those assets do not need to go on a register and their cost is treated like any other immediate expense. (Strictly speaking this may not be best practice, but as long as it is unlikely that the asset will subsequently be sold, then this is simpler and quite appropriate.)
Assets are shown in the balance sheet with their original
values and then accumulated depreciation shown by asset type. Clicking on the
original value line will show only changes (additions and disposals) made
during the year. Clicking on the accumulated depreciation will show the
depreciation applied during the year, either automatically via a “Run
depreciation” action in Xero or via a manual journal entry.
Bank balances
These should be the easiest to verify, at least if you have
been prompt and thorough in reconciling transactions.
If there is any difference between what Xero has as the
balance and your bank or other account shows, then track down what item or
items are responsible for the difference.
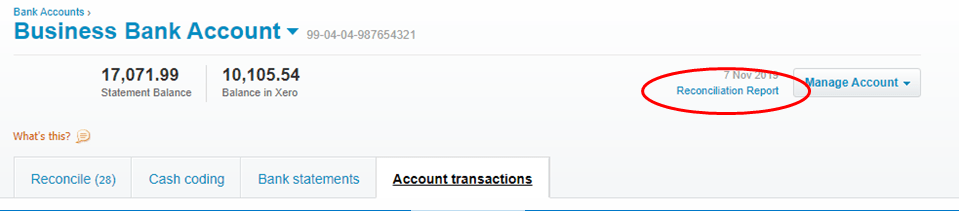
A simple reconciliation gap can be identified by running a
“Reconciliation report” on the account. See the link to do this below. This, of
course, show gaps up to the present day, not the last financial year end; but
if anything is hanging over from the last year, it should show.
The difference in values itself may be a clue to what is
wrong. The ultimate recourse is to get CSV exports from both Xero and the bank
and compare the two.
Accounts Receivable, Payable, and similar
For Accounts Receivable and Payables, Xero offers “Aged Receivables” and “Aged Payables” reports. If you want to check these are correct, you probably want to use the “Detail” version of these reports. In the main you are checking that those listed have really not been paid (i.e. no pending or misallocated transaction reconciliation) and that there are not bills or invoices which should have been entered by the year end but are missing from the list.
For Current Asset or Creditor Accruals, the report generated by clicking on the value shown in the Balance Sheet should suffice. What you are expecting to see is that last year’s balance was paid or accrued down and this year end balance is the sum of all the accruals that you know have occurred and/or would normally expect.
For example, for Creditor Accruals, you should see Debit entries totalling the year start balance and the year end balance being the sum of new credit entries, which you are confident are complete and correct. If the sum of debit entries does not total the starting balance, you should identify what is accounting for the difference and satisfy yourself that it really does remain outstanding.
Employee-related payables
Employee-related payables are Wages, PAYE tax, NI
contributions, and pension payments. Where payments relating to the last pay
run have been made before the year-end, then the balance should be zero.
Otherwise the amounts should be the values generated by the last pay run. (It
is possible that wages for some but not all staff have been paid. In such a
case, only the wages not yet paid by year-end should show as the balance.)
If the balances are not so easily explained, then use a
process similar to that described above for Accounts payable to identify
unmatched payables or payments.
Donor/Project reports
You can create reports for income and expenditure to date in the financial year by using your normal total revenue and cost report (which either is or will have been based on the standard “Profit and Loss” report and accessed via the “Reporting” menu) and filtering it via “Filter” for the project(s) in question, thus:

Clicking “Filter” brings up the one or two tracking categories you could filter by:
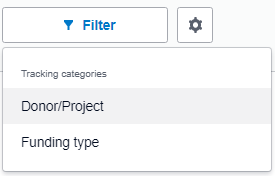
Click on one to get the options for that category:
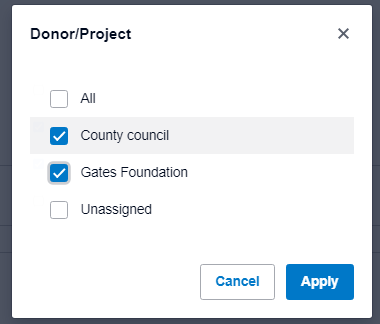
Select the project(s) you want a report for and press “Apply”.
The filters to be applied are then shown thus:

If you want to cancel one, just click the ‘x’ to the right of the name. You can add further filters from the other category by just repeating the process for that category.
When you are done choosing filters, press “Update” and the report will show income and expenditure for the period only relating to that project (or those projects).
You can Save as a Custom Report or Export via the respective
buttons at the bottom right of the page. If saving, remember: use a different
name from the base report and DO NOT make the report the default report for
Profit and Loss.
If editing the layout, be sure to “Save as ..” before
quitting, otherwise the changes will not endure. If meaning to create a new
report, rather than simply update the main one, then make sure to change the
name of the report.
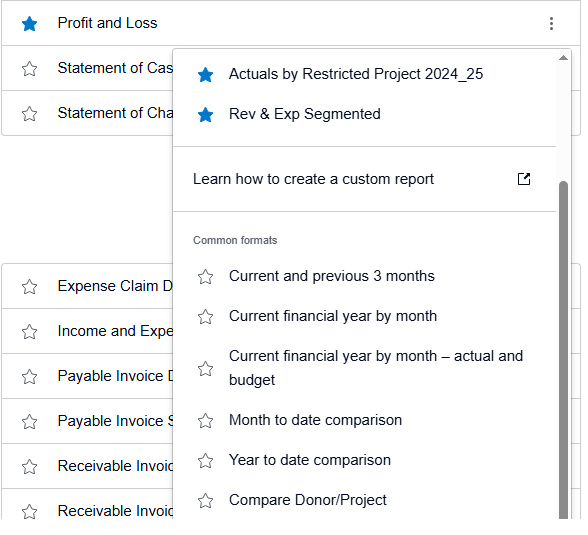
If you check more than one project for filtering, you will get the figures for all those projects combined. This is unlikely to be what you want. It won’t show you the figures for each project separately. To do that, edit the layout, as in the example under “Customising reports” below, in order to have a column for each project. Personally, I find it helpful to save as a permanent report one showing all current projects and the totals for all those projects. It gives management and trustees an overview of what is happening with all restricted funding. (Note that you can get a report for all active projects plus unassigned (untracked) revenue and expenditure under Profit and Loss by choosing the “Compare Donor/Projects” option from the 3 dot drop down at the right. However this runs into problems if you add – as suggested for the SOFA – a Reconciliation schedule with previous year balances. It is, though, a very painless way of seeing all income and expenditure by active project either for the current year (the default) or for another period, selected by then going to “Date Range”. If that is all you need, then don’t bother with customising reports as advised below.)
Note that Xero reports created for a particular date range type sometimes do not work well for other date range types. You have to change the date range in the report editor and then save as a different report if you want to be sure of correct reporting for a different date range type.
If you are allocating costs to projects via Manual Journal entries, note that single entries in the future will be in reports covering the journal entry date, but repeating entries (e.g. each month or quarter) will not appear in reports until the date for the entry has passed.
Customising reports
The “new” style reports in Xero allow quite a lot of helpful
report customisation. You can customise the language of the reporting to make
it more suitable to your activities. For example, changing out terms like
“profit & loss”, “sales”, “cost of sales” if these are inappropriate.
More importantly, you can change rows and columns displayed
and, for example, then get a totals row or column for a customised set of data.
Three important things to be aware of:
- An edited report does not stay as edited unless you save it via “Save as”. So if you want to use the new report again do save it as a Custom or Draft report. Unless you are sure that the edit is intended to change the base report, do not use the same name for the report as the base report name.
- If the base report is set up for reporting in relation to a financial year, then customised versions trying to report for custom dates spanning financial years won’t work. Generally for reports, I would advise using the “Following report date range” option for each column. Then the whole report will be for whatever date range you have entered in the report options (see below).
- If you start with a filtered report (say, “Advice Services” Activity/Class) and then edit the report (for, say, specific projects), you will lose the original filter as soon as you press Done for the editing. Up to that point the editor will show the filter applied as a report sub-heading but the resulting report will not show it, it won’t be applied and the filter will most likely not be available on the resulting report. However, there is now the capability to filter on both tracking categories at the same time in a report. So, for example, you could produce a report with all columns filtered for one value of one category and separate values for the other category. ( See also Matrix report using tracking categories.)

We can illustrate customisation via showing how to add or delete a project from an “Active projects YTD” report.
Active Project YTD actuals report
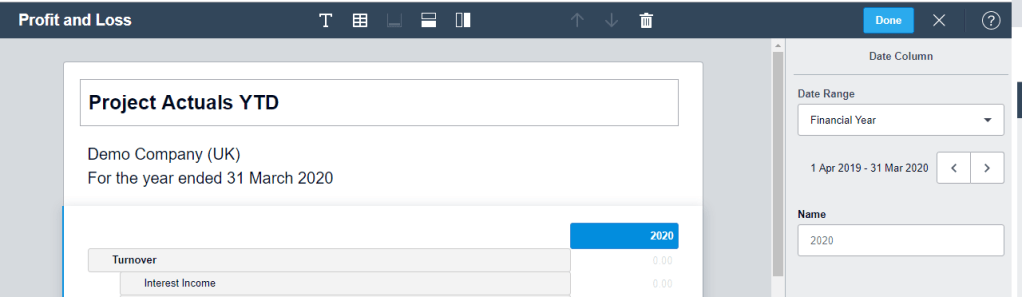
Start by using as the base report the overall Revenue & Expenditure (“Profit and Loss”) report. Click the “Edit layout” link at bottom left. Change the title at the top to one you think suitable (here it is “Project Actuals YTD”) and then click on the column shown (here headed “2020”). At the right are shown details for the column, including the type of “Date Range” and the name. To change the name, double click in the column header itself (the blue cell) and edit the name.
Now go right to the top and click the column icon to add a new column:

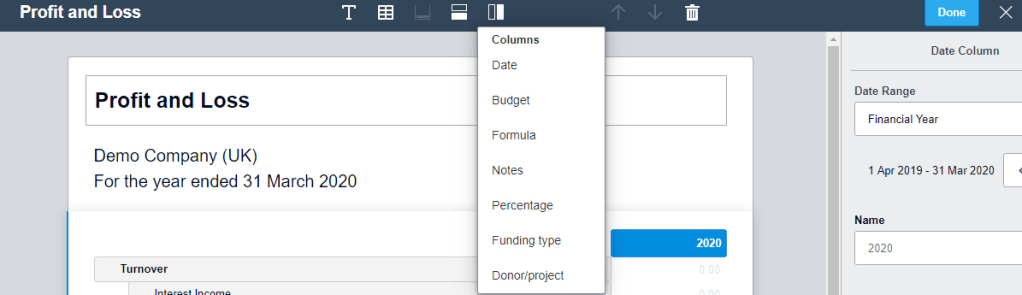
Choose the “Donor/Project” option. Then in the righthand pane, click the drop down for “Donor/Project” and select one of the projects you want included in the report, as below.

Add further projects in the same way. Then to create a total for all those projects, create a final Donor/Project column and then in the drop down, check all the projects that you want included in the total. Note that you can edit the column names via clicking the the (blue) cell of the selected column. You can also change the order of the columns via drag and drop in the main panel.
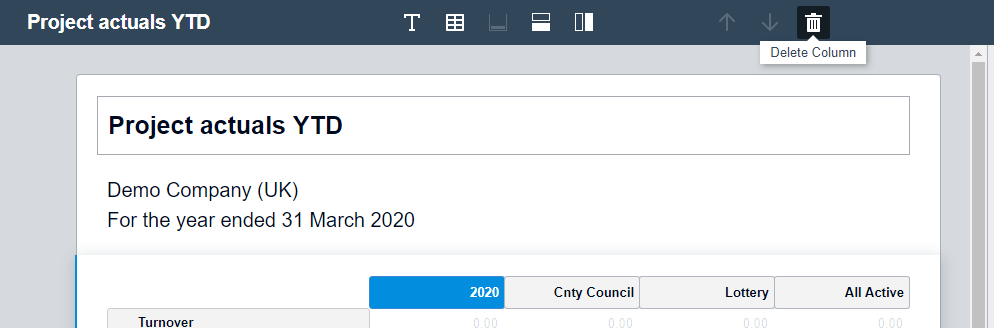
Now
delete the original “Date” column (here headed “2020”) by selecting it and then
clicking the trash icon in the top bar.
Then
press “Done” at right on the top bar. VERY IMPORTANT: now save the report as a
custom report via the “Save as..
Custom” at bottom right of the page. Give the report a suitable name
(probably the same as the report title) and DO NOT check “Make custom report
the default”, as that would make this the default Revenue & Expenditure
report.
You
can add projects or subtract them from this report by bringing up the report
from Accounting/Reports/Custom and selecting the report (or directly from
Accounting if you have made it a favourite), then clicking on the Edit button
at bottom left.
Note
that any change in the columns will NOT CHANGE the values in the “All
Projects” column. You thus need to select that column and adjust projects to be
included in that column. Hence every time you make a change to the projects
shown, the “All Projects” set of projects needs to be adjusted.
When you have finished editing, press the “Done” button at top right, then, if you want to keep the format, “Save as” at bottom right. Choose a new name if you want to create a separate report from the original (retaining the original report); otherwise keep the existing name.
Matrix report using tracking categories
SORP Oct 2019 has the following example analysis on p 48:
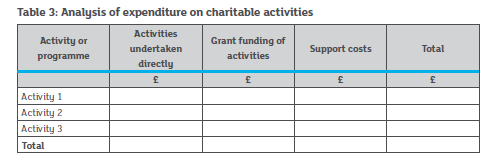
This kind of report could be produced in a couple of different ways. First, where the columns to be mapped are tracked via a tracking category and the analysis by row can be computed via Account codes and grouped appropriately. This would be the preferred way, as the report in Xero will appear as you ultimately need it.
If you have a cost, like staff costs, that would need to be recorded in more than one row, then having those rows be grouped by accounts codes won’t work. Most likely, you will need to use the second tracking category. In this case, you could create a report with columns, each filtered for one value of each category. You will then have to export this report (e.g. as a spreadsheet) and re-arrange the results. The report in Xero will look something like this:
| Directly/A1 | Directly/A2 | Total Directly | Grant/A1 | Grant/A2 | Total Grant | Support/A1 | Support/A2 | Total Support |
| £££ | £££ | £££ | £££ | £££ | £££ | £££ | £££ | £££ |
Custom date ranges for project expenditure
You may notice that if you play with date ranges on a Project Actuals YTD report or full financial year report, you only get results for the FY in which the later date resides.
To solve this problem, you need to set the date range for the relevant columns in the report to “Following report date range” (see shot below). This is at the right when you are editing a report and have selected one of the columns. Do this for every column whose date range you want to follow the main setting for the report.

Once you have done the edit, save the report under a new name if you want to keep the original report with fixed date ranges. Save with the same name if you only want the more flexible report.
Actual vs Budget report
As noted elsewhere, you might want a cleaner Actual vs
Budget report than the standard “Budget Variance” report. Here is my
suggestion. Start with the new style Profit and Loss report
Start editing this report via the “Edit layout” button at
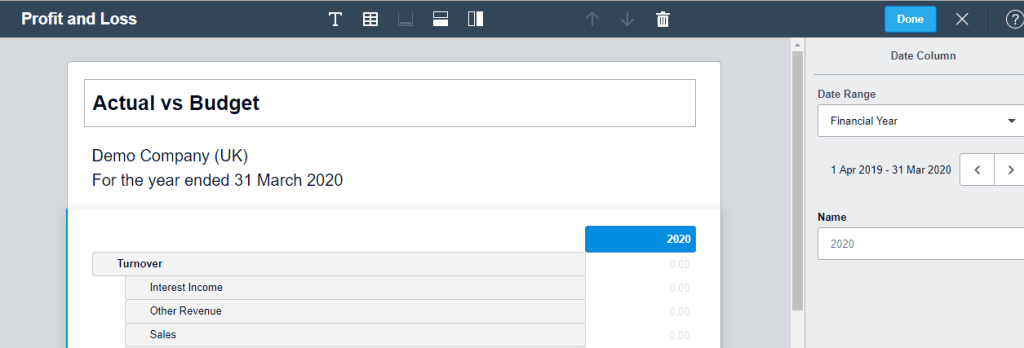
bottom left. Change the title at the top to one you think suitable (here it is
“Actual vs Budget”) and then click on the column shown (here headed “2020”). At
the right are shown details for the column, including the type of “Date Range”
and the name. To change the name, double click in the column header itself (the
blue cell) and edit the name.
Now go right to the top and click the column icon to add a new column:

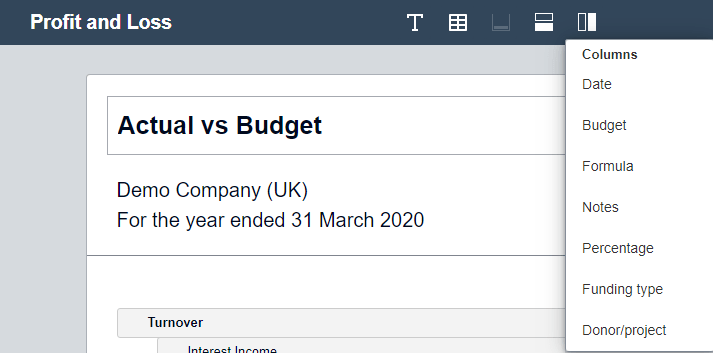
Choose the “Budget” option and select “Year to date” as the
date range. You probably want to edit the column name to something shorter than
the default name. Here I chose “YTD Budget”.
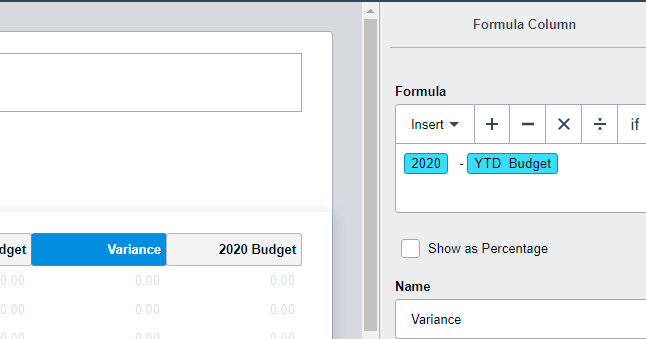
Add a third column of type “Formula”. Then insert the
formula of the first column minus the second. I have named this column
“Variance”.
Finally a fourth column, this time a Budget type and the date range set to “Financial Year”. Edit the name if you want it changed. You should now have four columns looking like the shot below.
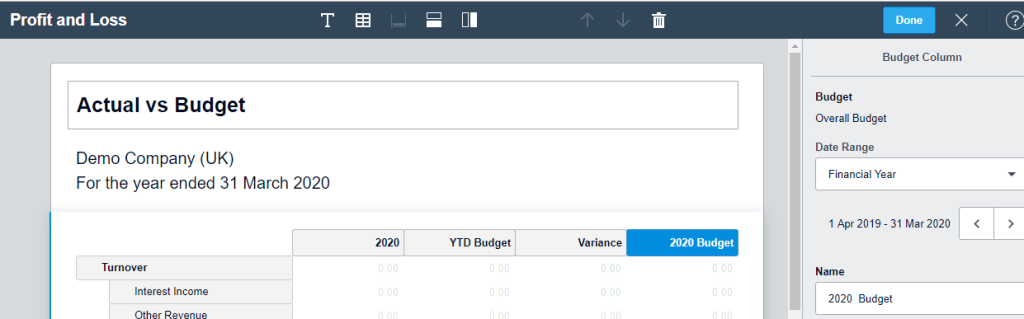
Press “Done” to see the resulting report. Assuming you have
the “Date Range” for the report set as “This Financial Year”, the YTD Budget
figures will show (weirdly) the same as the full year budget. Set the date
range to This Month, “Update” and you will get the figures you want.
Remember to save as a custom report otherwise you will lose
all this good work. Saving allows you also to change the name of the report
(from the original “Profit and Loss”). If you check “Make custom report
default”, then this report will pop up if you select the new style “Profit and
Loss” report from the reports menu. Up to you whether you want this or not.
SOFA and Related Reporting (UK)
I reproduce here 2 tables from the UK Charities SORP (FRS 102). Both are obligatory requirements, at least in their general intent – not to the letter of the detail.
Table 2 shows the requirements for a Statement of Financial Affairs (SOFA), except that small charities (less than £500k income) have the option not to show expenditure by activity (e.g. Raising funds vs Charitable activities) but instead to only show it by type of expenditure (e.g. Salaries, rent, etc.).
Obviously, a typical Revenue and Expenditure statement generated in Xero will show expenditure by type (Accounting code) not by activity. So if you feel you should show expenditure by activity, then the simplest approach would be to use different account codes for different activities and group the account codes by activity in their presentation. But if you have staff costs in more than one activity this would not be a good idea. So this simple approach will probably not work for most charities. (If splitting expenditure by activity is just a case of allocating, say, one third of the manager’s cost to Raising Funds, then it is probably easiest and safest to do this manually, after getting the relevant data out of Xero rather than within Xero.)
For the more general case – typically with salary costs split across more than one activity – I would suggest not showing the expenditure by activity in the main SOFA table (per Table 2 below) but in its own table. This table would show revenue and expenditure by activity on one axis and by fund type (Restricted, Endowment, Unrestricted, etc.) on the other axis. This is an example of a Matrix report as discussed above.
Since we need one Tracking code for projects and now the second Tracking code to be designated for “Activity” (or “Class”), we will have to get the fund type data by summing all the projects in each funding category. Obviously, this solution requires that each project/fund belongs entirely in one category and that we independently keep tabs on which funding type a project belongs to (perhaps via a naming convention).
That said, some comments on producing Tables 1 and 2.

Table 2 columns for revenue and expenditure by fund type (and the total) can be produced by customising a Profit and Loss report in the same way as discussed above for revenue and expenditure by project. In this case you can use the Tracking Category I earlier suggested naming “Activity/Class” for creating new fund type columns. Choose either “Financial Year” or “Following report date range” reports for the columns’ Date Ranges. For the “Prior period total funds” column, use “Financial Year” as the Date Range and select the previous year in the year selector on the line just below that.
If your only split is between Unrestricted and Restricted funds and you don’t want the bother of using the second Xero tracking category, then you can track all restricted projects with one category and simply use the sum of all restricted projects to get your Restricted funds total. As noted a little earlier, you will need to use this approach anyway if you need the second tracking category to distinguish between expenditures on different “Activities”.
You should note that this split of money flows by “Activity/Class” only gives the right result if all related transactions and journal entries are correctly coded for “Activity/Class”. This may seem easy enough but if you are allocating an employee cost to a project via using Employment Groups, then it is not possible at the same time to code their costs as, for example, “Restricted”. If you want accurate “Activity/Class” reporting in Xero, then you cannot use “Employment Groups” for per project (i.e. projects within the restricted fund type) cost allocation. You have to use journal entries instead.
Movement in Funds
To show “Transfers between funds”, you can create an Expense accounting code for this via the Chart of Accounts or ask your accountant to do this for you. You could name it “Interfund Transfer In/(Out)”. Suggested settings are as below:
To make the transfers, do a manual journal entry – or ask your accountant to do so – debiting the fund you are moving funds from and crediting the one receiving the funds, as in the example below:
To build a report showing the equivalent of the “Transfers between funds” and “Reconciliation” in SORP Tables 1 and 2, add a new “Movement in funds” Group if you have any interfund transfers, as below, else skip to the guidance that follows on “Reconciliation”. Do this via the add Row icom in the top bar.
Change the Group heading and settings thus:
Then drag the “Interfund transfers” row from the “Administrative Expenses” or similar Group into the new “Movement in funds” group. Then selecting that row, insert a new row as a Formula. Insert “Net Income/(Expenditure)”, or “Profit after tax” if you have not renamed that, as the formula and your preferred description as the Row heading:
Once “Done” and saved, this should produce lines at the end of the Income/Expenditure report like these:
Note: as regards “Other recognised gains (losses)”, these should be recordable in Xero and included in the computation of net income. Splitting out the presentation of these from normal operating income can be done by creating row groups for these and moving the related rows into their correct group.
Reconciliation/fund balances
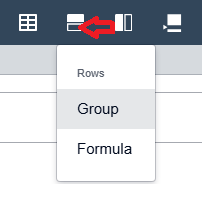
To build a report showing the equivalent of the “Reconciliation” in SORP Tables 1 and 2, create a new Schedule via the grid button at the top:
This creates a completely separate table below the main one, like this:
Change the Group heading and settings thus:
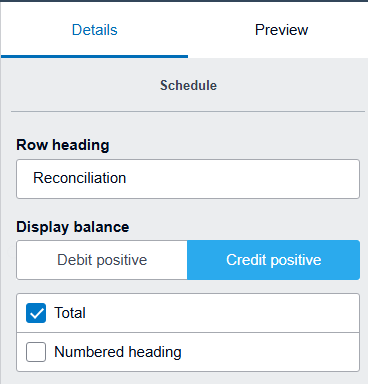
Click in “Add accounts” and add #960 “Retained earnings”.
Then add “Current Year Earnings” . Arrange these rows within the group as you prefer and add appropriate heading and total description.
The added group should appear below the Movement in funds group (if you have the former) something like:
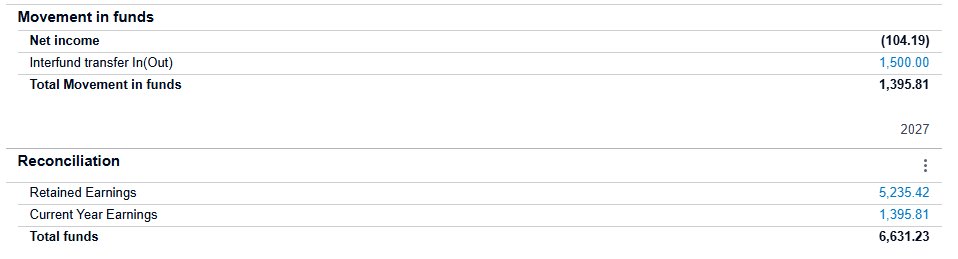
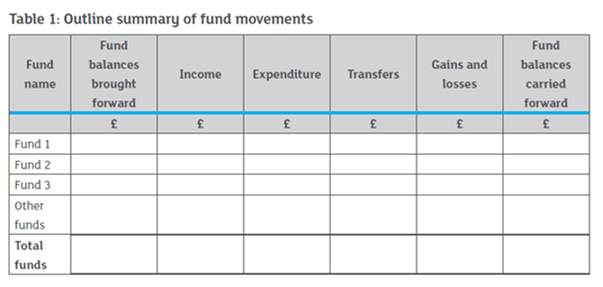
Table 1 is essentially a version of the revenue and expenditure by project report discussed earlier (though it has been pivoted). You don’t have to follow this exact presentation. You can instead follow the presentation of Table 2 and, in the same manner as for that table, add the “Fund Reconciliation” rows at the bottom to derive “Fund balances carried forward”.
